
River Discharge
A. I. Shiklomanov and R. B. Lammers
Water Systems Analysis Group
Institute for the Study of Earth, Oceans, and Space
University of New Hampshire, Durham, NH 03824
November 15, 2011
Highlights
- Total annual discharge, 1813 km3/year, in 2010 from the six largest Eurasian rivers (Sev. Dvina, Pechora, Ob, Yenisey, Lena and Kolyma) flowing into the Arctic Ocean was very close to the 1936-2009 long-term mean of 1808 km3/year.
- Mean annual discharge, 514 km3/year, in 2010 from the four large North American Arctic rivers (Mackenzie, Yukon, Back and Peel) was ~3% lower than the long-term mean (529 km3/year).
River flow is an integrated characteristic that reflects numerous environmental processes at play in the upstream drainage area. River discharge also plays a significant role in the fresh-water budget of the Arctic, accounting for about 2/3 of the freshwater flux to the Arctic Ocean. Ocean salinity and sea ice formation are, in turn, critically affected by this river input. Changes in the freshwater flux to the Arctic Ocean can exert significant control over global ocean circulation by influencing North Atlantic deep water formation (Rahmstorf, 2002).
River discharge to the Arctic Ocean from Eurasia during 1936-2010 increased at a rate of 2.9±0.5 km3/year (Fig. HTC32). The most significant positive trend (12 km3/year) for the six largest Eurasian rivers (Sev. Dvina, Pechora, Ob, Yenisey, Lena and Kolyma) occurred during the last 24 years (1987-2009) (Shiklomanov and Lammers, 2009). Total annual discharge from the six largest Eurasian rivers flowing to the Arctic Ocean in 2010 was 1813 km3/year, which was very close to the 1936-2009 long-term mean of 1808 km3/year. Based on Environment Canada and USGS data the mean annual discharge in 2010 from the four large North American Arctic rivers (Mackenzie, Yukon, Back and Peel) was 514 km3/year or ~3% lower than the long-term mean (529 km3/year) (Fig. HTC32).
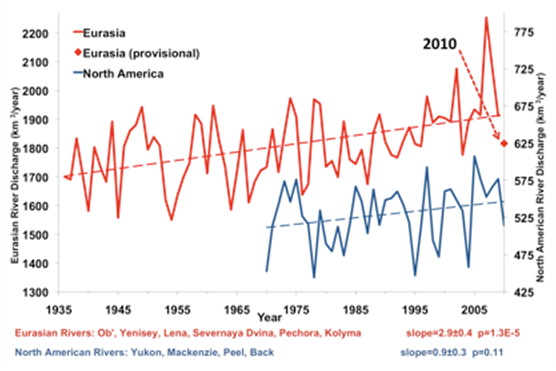 |
Fig. HTC32. Total annual discharge to the Arctic Ocean from the six largest rivers in the Eurasian pan-Arctic for the observational period 1936-2009 (updated from Shiklomanov and Lammers, 2009) (red line) and from the four largest North American Arctic rivers during 1970-2010 (blue line). The least squares linear trends are shown as dashed lines. Red diamond shows provisional estimate of Eurasian discharge for 2010. |
The Yenisey is the only large river in the Arctic drainage with significantly higher (6%) discharge in 2010 than the long-term mean. However, taking into account the large reservoir capacity and the potential for perennial storage regulation, the high discharge in the Yenisey could be partly due to reservoir regulation (Shiklomanov and Lammers, 2009). Discharge in 2010 in the Yukon, Pechora, Severnaya Dvina and Kolyma rivers was 5-15% lower than the long-term mean and the discharge of the Lena, Ob and Mackenzie basins were close (± 2%) to the long-term mean values (Fig. HTC33).
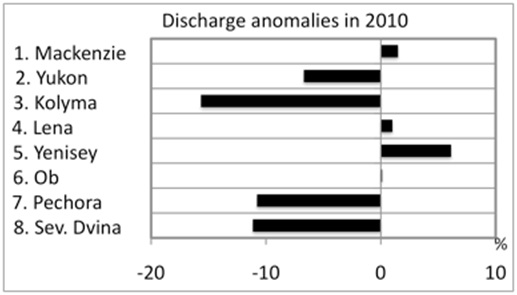 |
Fig. HTC33. Annual discharge anomalies (%) for 2010 relative to the long-term mean for the largest Arctic rivers. Provisional observational data were used for Eurasian rivers. |
Officially distributed river discharge data are usually processed and published with some delay, from 1 year for the USA and Canada to several years in Russia. This is related to (1) more complicated conditions for discharge computation in cold regions with a lengthy period of ice cover (Shiklomanov et. al. 2006), and (2) restrictive access to historical hydrological information in Russia. Driven by the need for more timely information to detect and diagnose changing hydrological conditions, techniques have been developed to estimate river discharge for large Arctic rivers in near real-time using operational stage observations, air temperature and river ice data. These provisional discharge estimates have been used to estimate river flux to the Arctic Ocean until 2010 and showed very small uncertainty against officially released historical data. Currently, the collection of these data is not supported and we applied a less accurate approach based on re-analysis data coupled with hydrological modeling to estimate river discharge. It is worth noting that the absence of real-time hydrological monitoring has caused significant deterioration in the reliability of Arctic river discharge estimates.
Simulated total river runoff for January to July 2011 accumulated across the eight largest Arctic river basins (Mackenzie, Yukon, Kolyma, Lena, Yenisey, Ob, Pechora, Sev. Dvina) is derived from the UNH Water Balance and Water Transport Model (WBMPlus) (Wisser et al, 2010). This model is forced with meteorological information from the Modern-Era Retrospective analysis for Research and Applications (MERRA) for the period from January 1979 to July 2011 to estimate river runoff and discharge across the pan-Arctic drainage basin. The results suggest that total river runoff for January to July 2011, averaged across 8 major Arctic river basins, was 24 mm (or ~17%) lower than the long-term mean observed during 1979-2010 (Fig. HTC34 upper panel). Most runoff during January-July is formed from snowmelt. This is reflected in the comparison of snow water capacity for April 2011, when snow storage is typically close to maximum, with the long-term mean for 1979-2010 from MERRA. The comparison shows 17 mm (water equivalent) less snow in 2011 across all 8 basins (Fig. HTC34 lower panel), consistent with our discharge estimates. Driest conditions in 2011 were seen in the northern Ob, middle Yenisey and southern Lena basins. All rivers except Kolyma show negative discharge anomalies in 2011 from -1% for the Mackenzie to -22% for the Lena (Fig. HTC35).
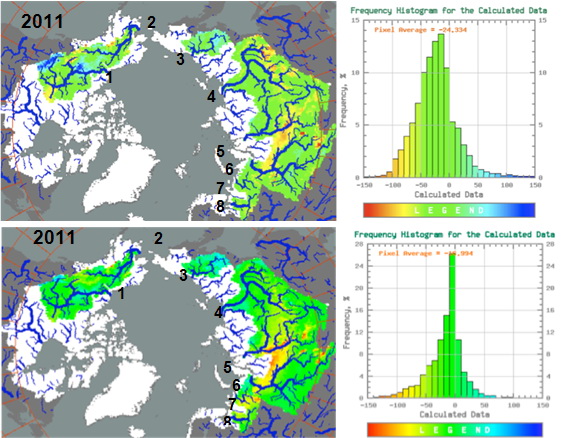 |
Fig. HTC34. Deviation of total runoff (in mm) for January-July, 2011 (upper panel) from the long-term mean for 1979-2010 evaluated with hydrological model simulations using MERRA data and deviation of mean monthly snow water equivalent (in mm) for April, 2011 (lower panel) from long-term mean over 1976-2010 based on MERRA data. Numbers show rivers: 1-Mackenzie; 2-Yukon; 3-Kolyma; 4-Lena; 5-Yenisey; 6-Ob; 7-Pechora; 8-Sev. Dvina. |
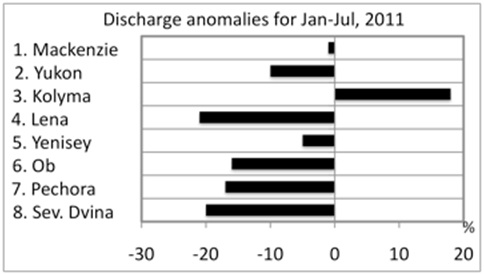 |
Fig. HTC35. Anomalies of mean river discharge (%) during January-July, 2011 relative to the long-term mean for 1979-2010. |
We understand that uncertainty of these discharge estimates varies significantly from one watershed to another. Analysis of correlation between simulated and observed discharge for 1979-2010 showed correlations 0.8 and higher for Mackenzie, Lena and Kolyma, 0.6-0.7 for Pechora, Sev. Dvina and Yukon, 0.5 for Ob and 0.3 for Yenisey. Thus our discharge estimates for Yenisey and Ob are much less confident than for other rivers. However, based on information from ROSHYDROMET our preliminary conclusion is that the 2011 spring floods in Siberia and northern European Russia were normal or less than normal. Maximum spring peak flow, which describes the timing of flow, was observed 7-20 days earlier than the long-term mean in Siberia. For the downstream gauge, Yenisey - Igarka, it was the second earliest spring flood during the 1936-2011 observational period (Fig. HTC36). These results are consistent with analysis of trends showing earlier spring flood timing for multiple gauges across Eurasian pan-Arctic (Shiklomanov et al. 2007) and with the record-setting early spring snowmelt across Eurasia (see Fig. HTC3b in the essay on Snow).
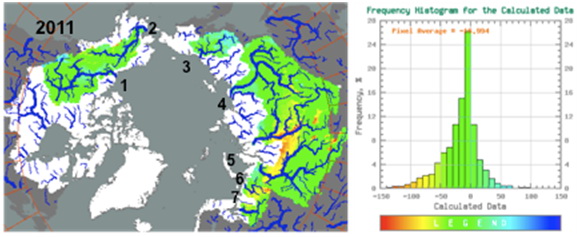 |
Fig. HTC36. Deviation of mean monthly snow water equivalent (in mm) for April, 2011 from the long-term mean for 1976-2010 based on MERRA data. Numbers show rivers: 1-Mackenzie; 2-Yukon; 3-Kolyma; 4-Lena; 5-Yenisey; 6-Ob; 7-Pechora; 8-Sev. Dvina. |
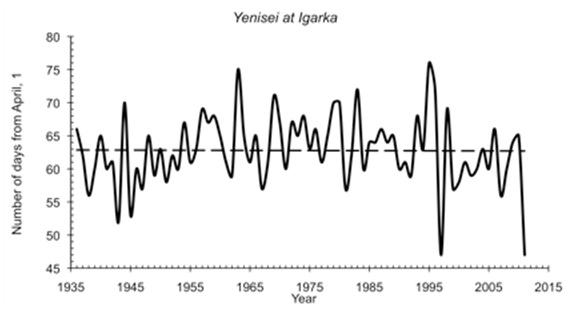 |
Fig. HTC37. Long-term variability of date of spring peak discharge for Yenisey - Igarka plotted as number of days from April 1. In 2011 the flood peak was the second earliest on record. |
References
Bosilovich Michael G., Junye Chen, Franklin R. Robertson, Robert F. Adler. (2008), Evaluation of Global Precipitation in Reanalyses. Journal of Applied Meteorology and Climatology 47:9, 2279-2299.
Rahmstorf, S. (2002), Ocean circulation and climate during the past 120,000 years. Nature 419, 207-214.
Rawlins, M.A., Lammers, R.B., Frolking, S., Vörösmarty, C.J. (2006), Simulated Runoff and Evapotranspiration across Alaska: Model Sensitivity to Climate and Land Cover Drivers, Earth Interactions, 10, doi: 10.1175/EI182.1.
Rienecker, M.M.. M.J. Suarez, R. Todling, J. Bacmeister, L. Takacs, H.-C. Liu, W. Gu, M. Sienkiewicz, R.D. Koster, R. Gelaro, and I. Stajner, (2008), The GEOS-5 Data Assimilation System - Documentation of Versions 5.0.1 and 5.1.0. NASA GSFC Technical Report Series on Global Modeling and Data Assimilation. NASA/TM-2007-104606, 27, 95pp.
Shiklomanov A. I. and Lammers R. B., 2009: Record Russian river discharge in 2007 and the limits of analysis. Environ. Res. Lett. 4 045015 (9pp). doi: 10.1088/1748-9326/4/4/045015.
Shiklomanov, A. I., R. B. Lammers, M. A. Rawlins, L. C. Smith, and T. M. Pavelsky, (2007), Temporal and spatial variations in maximum river discharge from a new Russian data set, J. Geophys. Res, 112, G04S53, doi:10.1029/2006JG000352.
Wisser, D., B. M. Fekete, C. J. Vörösmarty, and A. H. Schumann (2010): Reconstructing 20th century global hydrography: a contribution to the Global Terrestrial Network- Hydrology (GTN-H), Hydrology and Earth System Science, 14, 1-24.